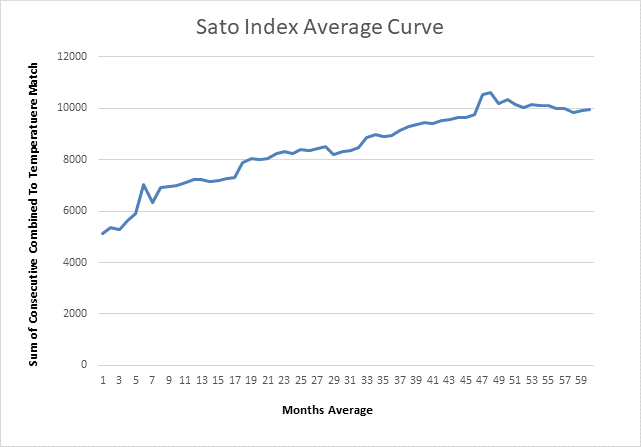
This is a GIF animation of Figure3 from the paper
Combining the Sources of Temperature Change
Each frame represents an average from 1 to 60 months. Each point on the curve is the sum of Consecutive Combined To Temperature matches for that average curve for each the multiply values from Table 1.